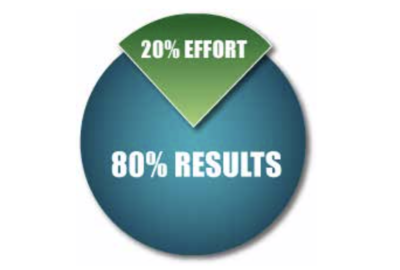
The Law of 80-20: Getting your CRM Data Right

Since then the 80-20 rule has been applied to all sorts of situations. For instance in business that 20% of a company’s customers account for 80% of sales, or that 80% of customer complaints come from 20% of customers, and so on. Often the numbers are no more than a broad approximation, but that is not the point. It’s all about focusing your efforts on the things that really matter.
And Customer Relationship Management (CRM) is no exception to this rule. Associations know that their current and future success depends on developing & maintaining excellent relationships with their members and prospective members. Strong relationships help to attract new members, enhance existing member loyalty and thereby generate additional revenues. So many have already invested, or are considering investment in, specialised CRM platforms and software systems that support these vital CRM activities.
So far, so good. But there’s often a hitch when you invest in CRM. And it’s another (albeit modified) example of the 80-20 rule. According to Gartner, IBM and others who have researched the CRM space, only 20% of CRM implementations succeed in meeting their original objectives of improving marketing, sales, revenues, customer service and so on. Surprisingly 80% do not. Not an impressive track record.
There are many reasons why a CRM initiative can fail, but in at least 80% of the cases there is always one critical factor that is always cited. It’s not to do with requirements capture, creep or management, hardware or software problems, networking or the other common issues that can derail any IT project. It’s all about the one thing all CRM activities and all CRM systems ultimately depend on. It’s the fuel that drives any CRM engine. It’s the data the systems and processes need to work with. If this data fuel is contaminated, the outcome is inevitable – underperformance and, all too often, often failure.

I have examined and analysed a lot of CRM data over my career. Like bad pennies, the same types of data problems surface time and time again. Some of these include:
- Simple name and address spelling errors
- Prefix titles that do not align with first names, e.g. Mr. Charlotte or Ms. John
- Missing data – blank postcodes, email addresses etc.
- Misfielded data, e.g. names in address fields, national insurance numbers in text fields
- Varying data formats for the same field, e.g. telephone numbers held in multiple formats
- Data duplication, i.e. the same customer replicated in numerous multiple duplicate records within the same CRM system or across systems. In one CRM system I analysed, the organisation had over 4,000 variations of the same business customer name.
So what? There is a huge amount of evidence that data defects and anomalies such as these can have a significant adverse impact on both organisations and individuals. Here are a few examples from recent research:
- On average organisations waste 15-18% of their budgets dealing with data problems
- 56% of UK marketing organisations say managing data quality is a significant challenge
- 36% of individuals had their name spelt incorrectly in a marketing communication
- Bad data can cause a telemarketing campaign to be up to 30% less effective
- Overall, UK businesses waste £75 million a year on pointless marketing waste
And the overall impact of this on organisations? The main ones include lost revenue opportunities, higher operational costs, potential non-compliance with legal and regulatory requirements, and brand damage. For the individuals affected, this also creates annoyance, frustration and sometimes even reputational damage. The end result is that individuals are less likely to do business with an organisation; the polar opposite of what the organisation intended. They may also tell their friends and colleagues about their bad experiences via social media and other channels, so the damage can quickly spread.
If the negative effects are so harmful why do these problems continue to occur? There are many reasons, but some of the main ones are:
- Failure to track and account for data volatility. Over a typical UK year over three million people move house, over half a million people die, more than half a million people immigrate to the UK, and over 300,000 emigrate. Business related data volatility is even more pronounced. Nearly half a million new companies are formed each year. The average rate of data decay in a UK B2B CRM database is around 2% per month. That means around a quarter of your data will be obsolete at the end of a year unless positive action is taken to correct it.
- Data input errors, falsifications & omissions. According to recent research carried out DQ Global UK 76% of all CRM records are damaged by poor data entry. Whenever people input data, they inevitably make mistakes.
- Data processing and migration problems. The same DQ Global UK research estimates that 53% of CRM records are damaged during system changes; 48% are damaged during data migrations.
- Poor design and execution of business & IT processes. Too many processes damage, rather than enhance, data. Often they encourage the creation of duplicate customer records, allow data inputters too much leeway to put the wrong data in the wrong place, and do not measure the quality of the data input in any methodical or regular way.
- The absence of agreed data standards and rules which govern how data should be managed. All too often what is basically the same data is created and stored in such varieties in so many different places that it is well near impossible to reconcile and integrate it.
- Lack of accountability for CRM data. In too many organisations the business regards data as solely an IT responsibility. It isn’t. Data is a business asset and needs to be managed and nurtured as such. IT of course does have an important part to play, but that is in a supporting role. But all too often no one is ultimately responsible for getting the data right. Inevitably, therefore, the problems get worse and worse...

I like this analogy from the Cutter Consortium’s Ken Orr:
“Ultimately, poor data quality is like dirt on the windscreen. You may be able to drive for a long time with slowly degrading vision, but at some point you either have to stop and clear the windscreen or risk everything”

So how can Associations start to tackle their CRM data problems? First, it must be stressed that every organisation is unique so the exact approach will depend on such questions as:
• Is the data being improved to prepare it for migration to a new CRM platform or to improve the performance of an existing CRM platform?
• Does the business side of your organisation understand that data quality is their responsibility?
• How aware are your organisation’s people of the principles and practices of good data management?
• Where are my particular pain points and what are my data improvement priorities?
Nevertheless there are some strategies and approaches that do work in all the above scenarios, albeit with variations. From my experience with working with large and smaller organisations I would suggest the simple six-stage approach illustrated here in Figure 1:
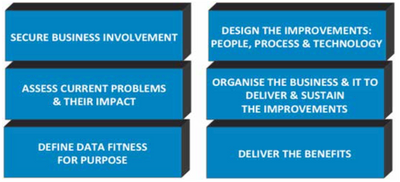
The purpose of each stage is outlined below. Note that these six stages should not be seen as a strictly sequential set of activities, with one stage completed before the next begins, but more as a series of iterative action domains that need to be tackled in any CRM data improvement initiative.
STAGE 1 – SECURE BUSINESS INVOLVEMENT
Recognise that data is a business asset and cannot be improved in any sustainable way without business leadership and active participation. To gain initial business buy in it’s essential to:
• Lay out a clear vision and intent for the data quality improvement initiative. Why are you doing it? What problems are you trying to solve? What benefits do you anticipate if you get it right? Capture these motivations in simple language and be able to present them in a way that all Association employees can understand and relate to.
• Identify and engage with all the key data stakeholders – creators, inputters, data consumers and others - across your Association. Try to sell them your vision and use these contacts to refine and enhance it. As you talk to people gather evidence and examples to illustrate the impact of current problems and the potential benefits of addressing them.
• Find and secure a senior business champion who can help you sell your vision to the top of the Association and support you in breaking down the barriers you will probably face. Data improvement nearly always requires cross-business collaboration and a senior business champion can help you obtain this.
• Finally produce an initial outline business case for action. Use this, with the help of your senior champion, to secure some early funding and resource so that you can kick-start the work.
STAGE 2 – ASSESS CURRENT PROBLEMS AND THEIR IMPACT
You now need to put some flesh on the bones by delving into specific CRM data problems and their causes and impacts. As you do so create and maintain a log of specific problems.
An effective way of tackling this stage is to:
- Profile and analyse the data currently held within your CRM system(s) to assess the scope and scale of specific data problems. For example, how many addresses do not contain valid postcodes? How many customers have valid email addresses? And so on. Specialised data profiling tools are available to help accelerate this work, but eyeballing the data on spreadsheets can often be an effective starting point.
- Organise interviews and workshops with stakeholders to present the issues that you have found and use these to explore questions such as:
- What is the impact of these problems on customers, suppliers, the business and IT?
- What problems are most pressing? Which cause the Association the greatest pain?
- Why might they be occurring? What are the root causes of the problems? Process failures? Human errors? Poor training? IT faults?
- Who is responsible for the errors and who should address them?
- Use these to home in on the problems that really matter. You cannot solve all the data issues you will come across. Remember the 80-20 rule. What’s important is that you start to tackle the ones that really matter in the eyes of your major stakeholders.
- Once you’ve got a good understanding of the core issues, revisit and enhance the business case to start to tackle them, and acquire the resources you need.
STAGE 3 – DEFINE DATA FITNESS FOR PURPOSE
Here you now need to focus on the one or more key data quality problems that have emerged from the previous stage. For each of these problem areas:
- Determine the really important business data items & records that need to be improved, for example email address, customer contact address, company billing address, product code etc. Again the 80-20 rule applies. Focus on the 20% of data items that cause you 80% of your data problems.
- Work with the business and IT stakeholders identified earlier to define these items in clear business terms so that all can understand and relate to them. Then set the required standard for the data item or record and create & enforce the business rules that control both their format and content. For example, what does a customer record need to contain to be mailable? What should a valid telephone number look like and contain before use in a telemarketing campaign?
- Set realistic and incremental improvement targets, based on the current levels of adherence of the data to the standards laid out. Remember that data quality enhancement is a continuous process of improvement, not a one off project, so aim for gradual change. For instance, “Reduce returned mailings by 15% per annum for the next three years”; “Ensure that 85% of customer addresses have valid postcodes by April 2016 and 95% by April 2017”and so on.
- Finally it’s vital to put some measures in place to baseline the current state of the data and to track changes. Ensure these measures are updated on a regular basis and report on them via a dashboard or similar tool to show that improvement is happening. Wherever possible include a business impact measure, for example each 1% reduction in returned mailings saves your Association £1,000. This helps to ensure that the benefits of the improvement work are quantified and demonstrates the business value of the work. Try to get the key measures reported to your Associations Board or Executive Team to maintain their interest and awareness. Use your senior champion to facilitate this.
STAGE 4 – DESIGN THE IMPROVEMENTS: PEOPLE, PROCESS & TECHNOLOGY
For each of the data problem areas identified, you then need to undertake an improvement project. Note that as data quality improvement is a business challenge, these business change projects require business leadership, with IT in a supporting role.
Important to note here is:
- As indicated earlier, data quality problems emanate from both business and IT issues. So designing improvements requires a holistic approach, usually encompassing business process change, people education and training, and new or amended IT. In some cases problems can be improved without the need for new or enhanced IT. The key point is that they are almost never an IT only problem, so don’t consider them as such.
- As a general rule, ensure that the improvements you design are sustainable. Do not settle for a one off data cleansing exercise on its own as it never solves the underlying problems. In a year’s time another cleanse will be needed, then another and another. Find permanent fixes that will continue to reap benefits after the project has ended. Ensure these improvements become an integral part of your business as usual processes.
- If you budget allows for it, look to acquire specialised data tools to support the work. These tools can be used to:
Profile & analyse data
Create and manage data improvement workflows
Set up data glossaries and dictionaries to hold data definitions and business rules
Correct data defects
Enrich existing data
STAGE 5 – ORGANISE THE BUSINESS & IT TO DELIVER & SUSTAIN THE IMPROVEMENTS
Having designed the changes, you are now ready to implement them. A few important tips:
• Remember that data improvement projects are business change projects and so are subject to the usual principles, disciplines & practices of project management. This includes the creation of a project board, the appointment of a project manager, progress reporting, risk management and so on.
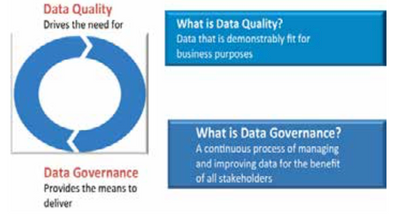
• Even more critical, however, is the need to engage business stakeholders in a way that they take active and longer term responsibility for the improvement of the data. This is essential both to implement and sustain the improvements. And this is where the emerging discipline of Data Governance has a key role to play. Data Governance is a business function, designed to ensure that the business assigns clear individual responsibility and accountability for its data. Its synergy with data quality is shown here at Figure 2:
• Using the principles of Data Governance, each business data item or record is assigned to a named individual, often designated a data owner and / or data steward. They should play a key role in the projects delivering the initial improvements and ensuring the benefits are sustained by stewarding the data as part of business as usual processes.

STAGE 6 – DELIVER THE BENEFITS
As the improvement projects are delivered, the benefits accrued should be tracked and reported on. A few final tips:
• When completing any data improvement project review what went well and can be reapplied and reused in further projects, and what might have been better. Ensure the lessons learnt are shared and put into practice in the next improvement project.
• After any successful project create and communicate a short, business friendly case study. This will help to promote its benefits and value, and retain support for data improvement across your organisation.
• After the project has ended continue to report on the data improvements delivered & planned through business as usual data governance reporting mechanisms.
In summary, I believe that adapting this proven six-stage approach to CRM data quality improvement will reap rewards. As a final plea, don’t invest in new CRM technologies or processes without making a parallel investment in data improvement. Data improvement may only constitute 20% of the cost and effort, but I would wager that it could solve 80% of your CRM problems. Why not give 80-20 a try? It worked for Pareto.